Canada Immigration by Province

This article examines where new permanent residents to Canada have settled over the last decade. It includes two detailed infographics.
Where have all the new immigrants to Canada settled over the past decade?
New Immigrants From 2005 to 2014
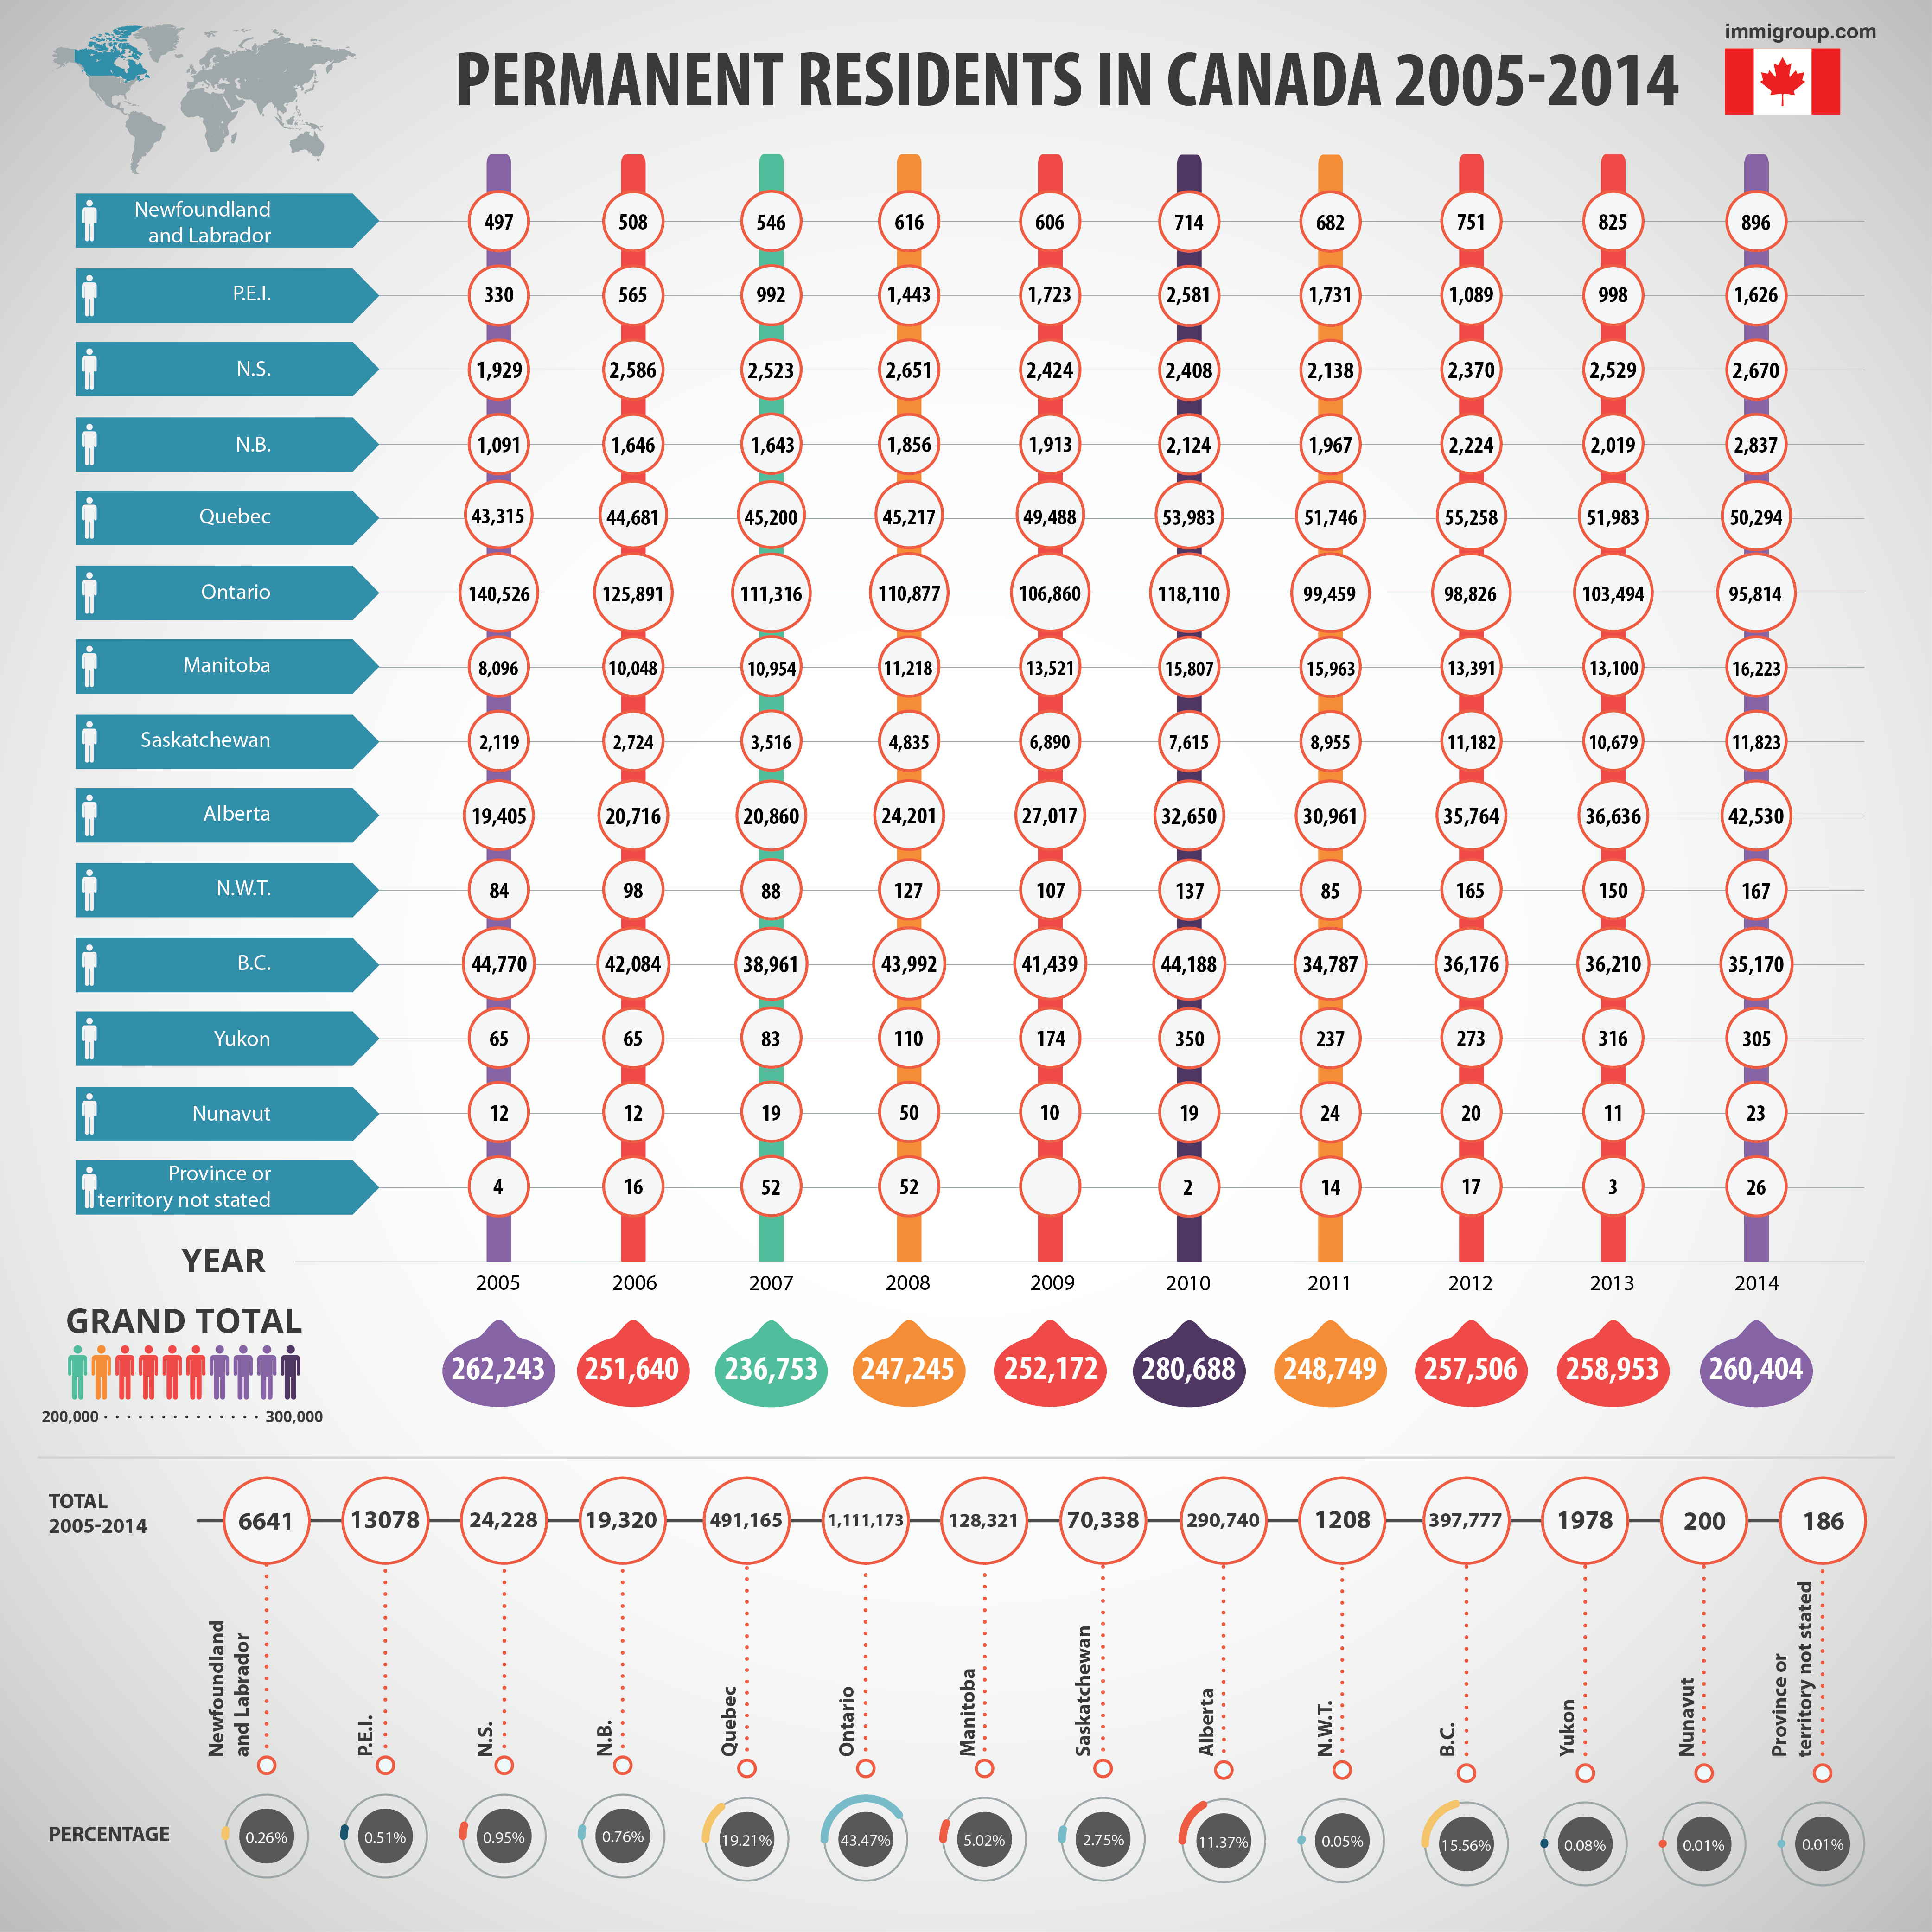
Immigration Constant Over a Decade
From 2005 to 2014, the number of immigrants to Canada steadily fluctuated in peaks and valleys with an average of 253,000 permanent residents arriving in Canada per year. During this span, 2007 showed the lowest influx of immigrants at 236,753 new permanent residents. 2010 saw the highest influx of immigrants with 280,688 permanent residents arriving in Canada.
What led to the lower levels of immigration in 2007 (or 2004, which had a very similar number)? To take 2004, for example, immigration numbers for 2004 might seem low in comparison to later years; however, 2004 actually saw an increase in immigration from the 221,352 immigrants and refugees arriving in 2003. The 235,823 new permanent residents who arrived in Canada in 2004 fell within target range as projected in the Annual Report to Parliament on Immigration in the previous year.
What led to the increase in immigration in 2010? According to Statistics Canada, one contributing factor was a drive to decrease the backlog of applications awaiting processing that had built up over the previous years. In addition to the expedited processing of applications, half-way through 2010, Canada announced that it would increase the number of “economic” immigrants (skilled workers) allowed to enter the country. Lastly, more immigrants were granted entry to Canada during 2010 as a result of the Haiti earthquake and due to the Provincial Nominee Program.
The table below shows the number of immigrants entering Canada per year from 2004 to 2014.
| Year | Number of new Permanent Residents |
|---|---|
| 2004 | 235,823 |
| 2005 | 262,243 |
| 2006 | 251,640 |
| 2007 | 236,753 |
| 2008 | 247,245 |
| 2009 | 252,172 |
| 2010 | 280,688 |
| 2011 | 248,749 |
| 2012 | 257,506 |
| 2013 | 258,953 |
| 2014 | 260,404 |
Most Popular Provinces: Ontario and Quebec Still the Most Popular Places to Settle
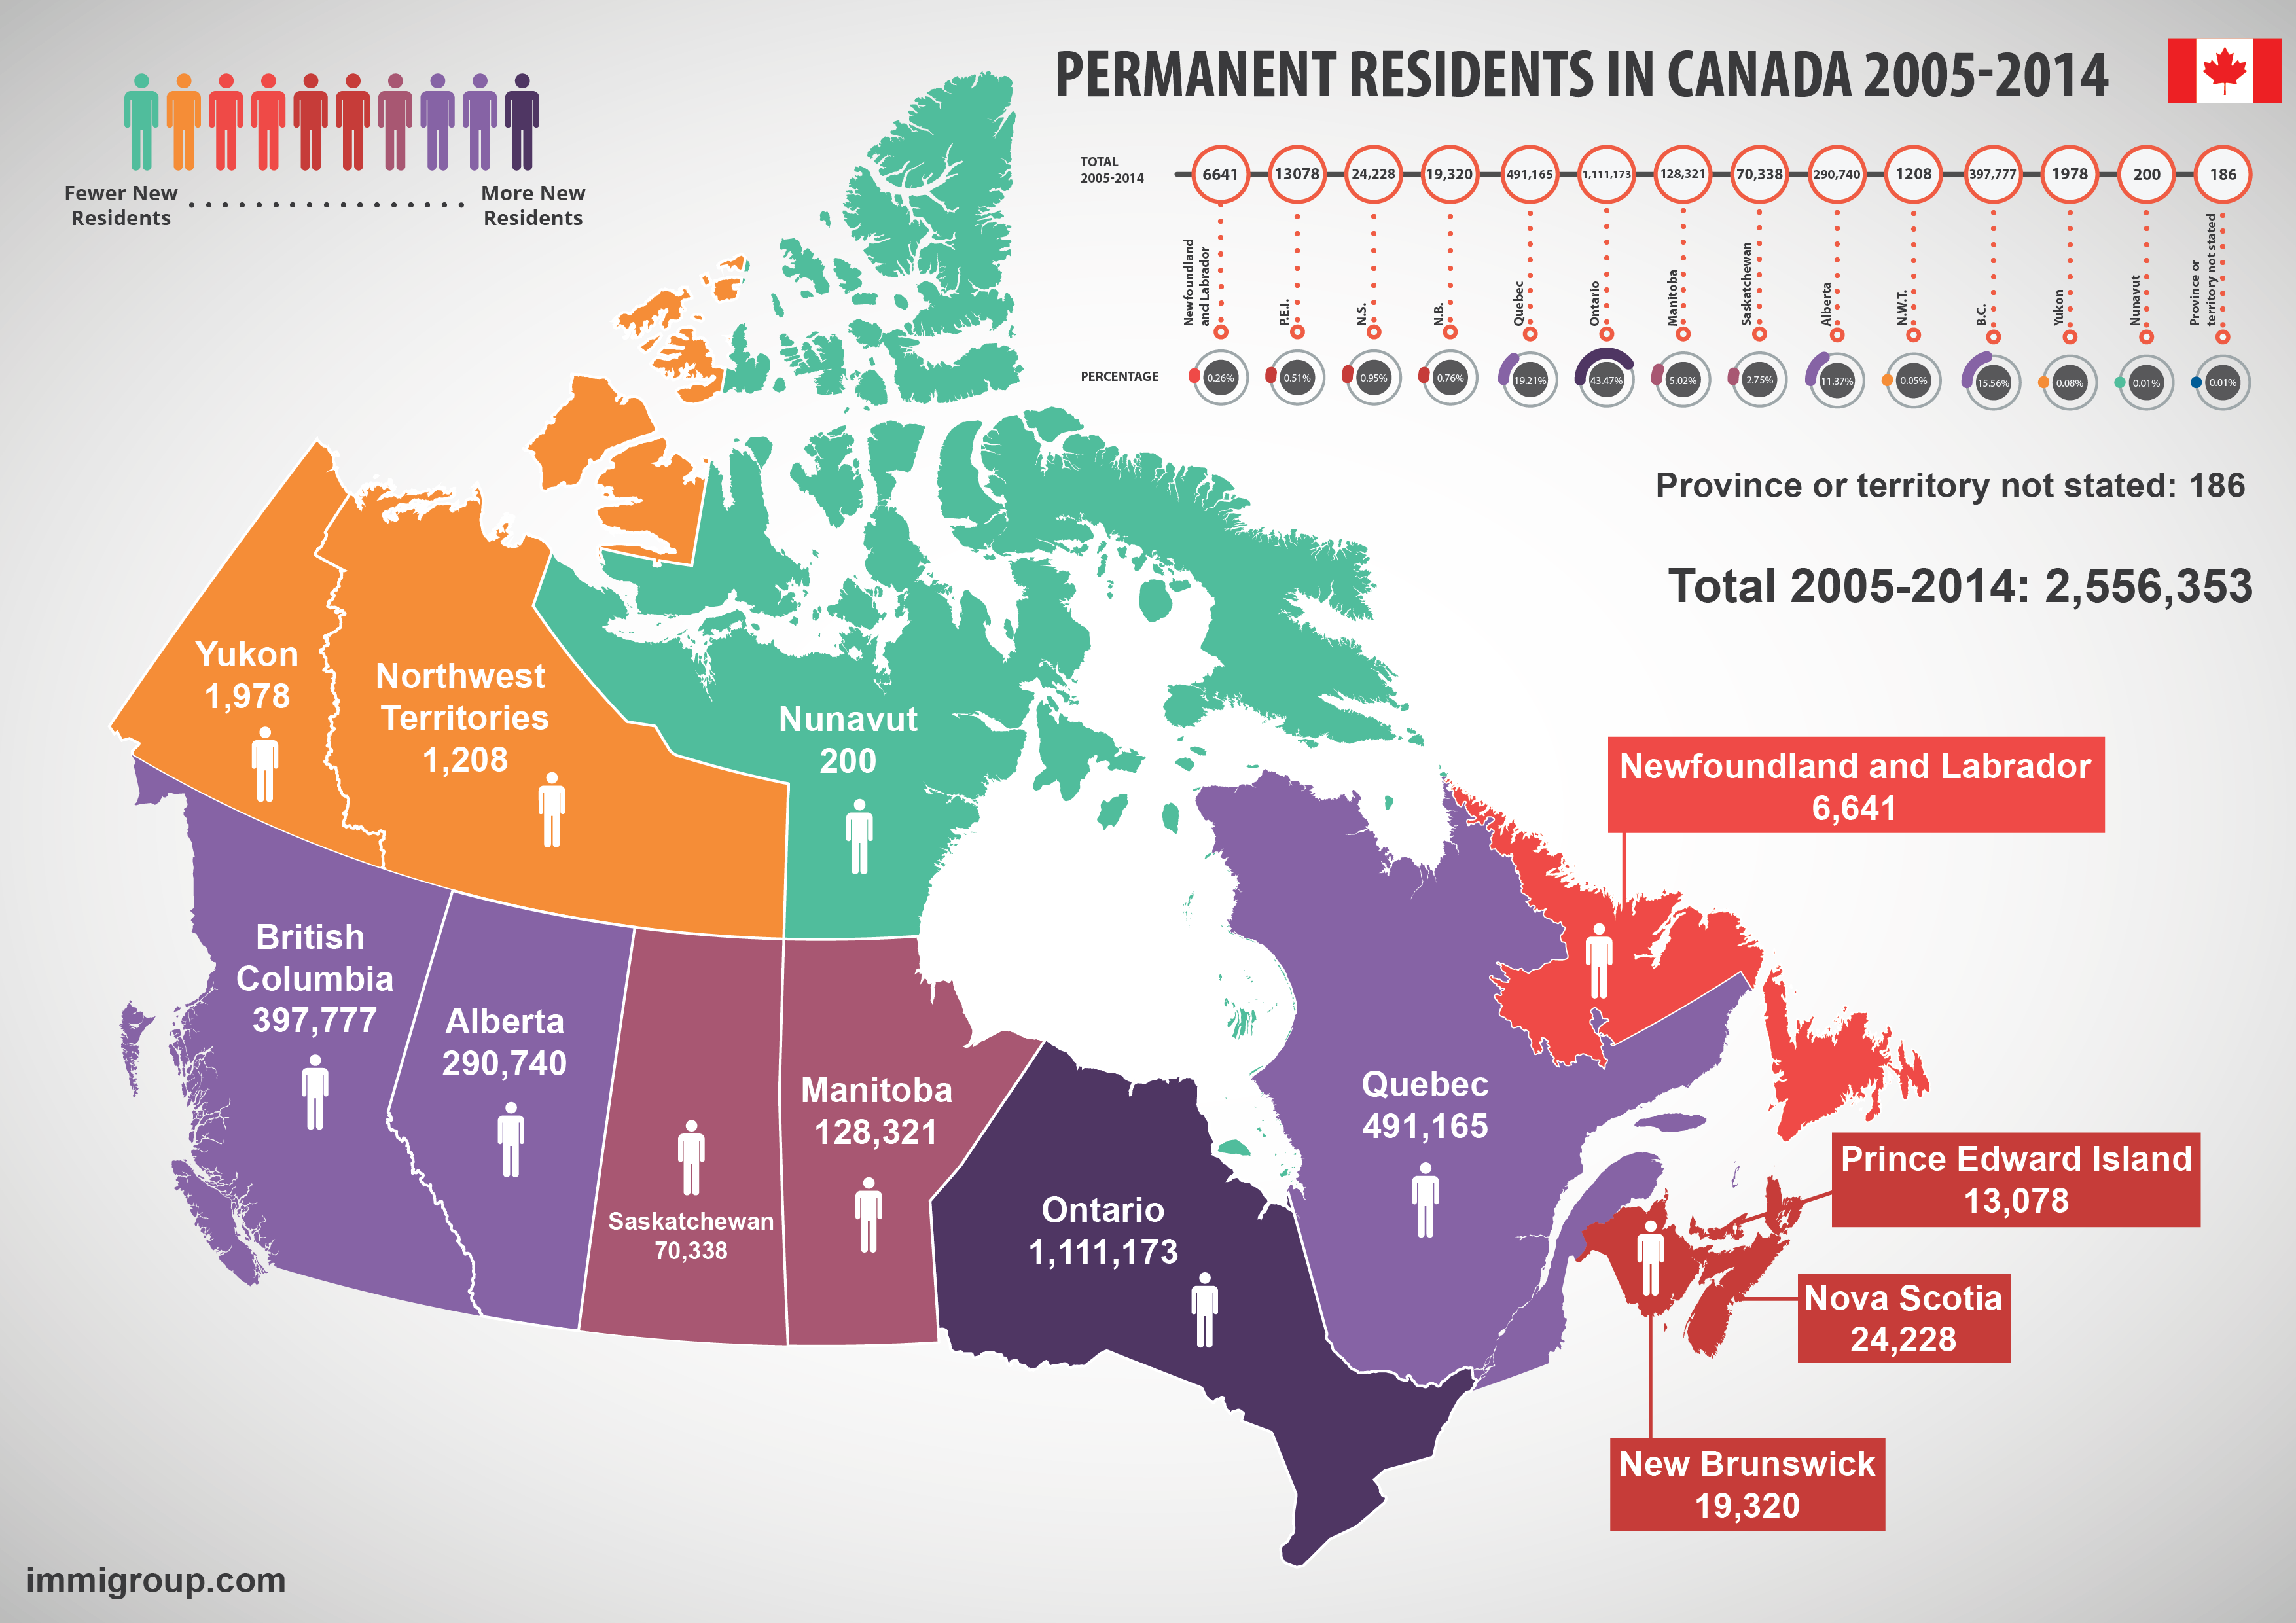
Of the new permanent residents who came to Canada from 2005 t0 2014, the greatest percentage (43.47% or 1,111,173 individuals) settled in Ontario, as you would expect. The second most preferential province of settlement for new permanent residents over this span was Quebec with 19.21% (or 491,165 individuals) settling there. People still choose the most expensive places.
The table below shows each Canadian province in order of popularity for immigrating populations from 2005 to 2014.
| Province/Territory | Percentage of New Immigrants 2005-14 | Total New Immigrants 2005-14 |
|---|---|---|
| Ontario | 43.47% | 1,111,173 |
| Quebec | 19.21% | 491,165 |
| British Columbia | 15.56% | 397,777 |
| Alberta | 11.27% | 290,740 |
| Manitoba | 5.02% | 128,321 |
| Saskatchewan | 2.75% | 70,338 |
| Nova Scotia | 0.95% | 24,228 |
| New Brunswick | 0.76% | 19,320 |
| Prince Edward Island | 0.51% | 12,078 |
| Newfoundland and Labrador | 0.26% | 6,641 |
| Yukon | 0.08% | 1,978 |
| Northwest Territories | 0.05% | 1,208 |
| Nunavut | 0.01% | 200 |
| Unknown | 0.01% | 186 |
Immigrants in Toronto

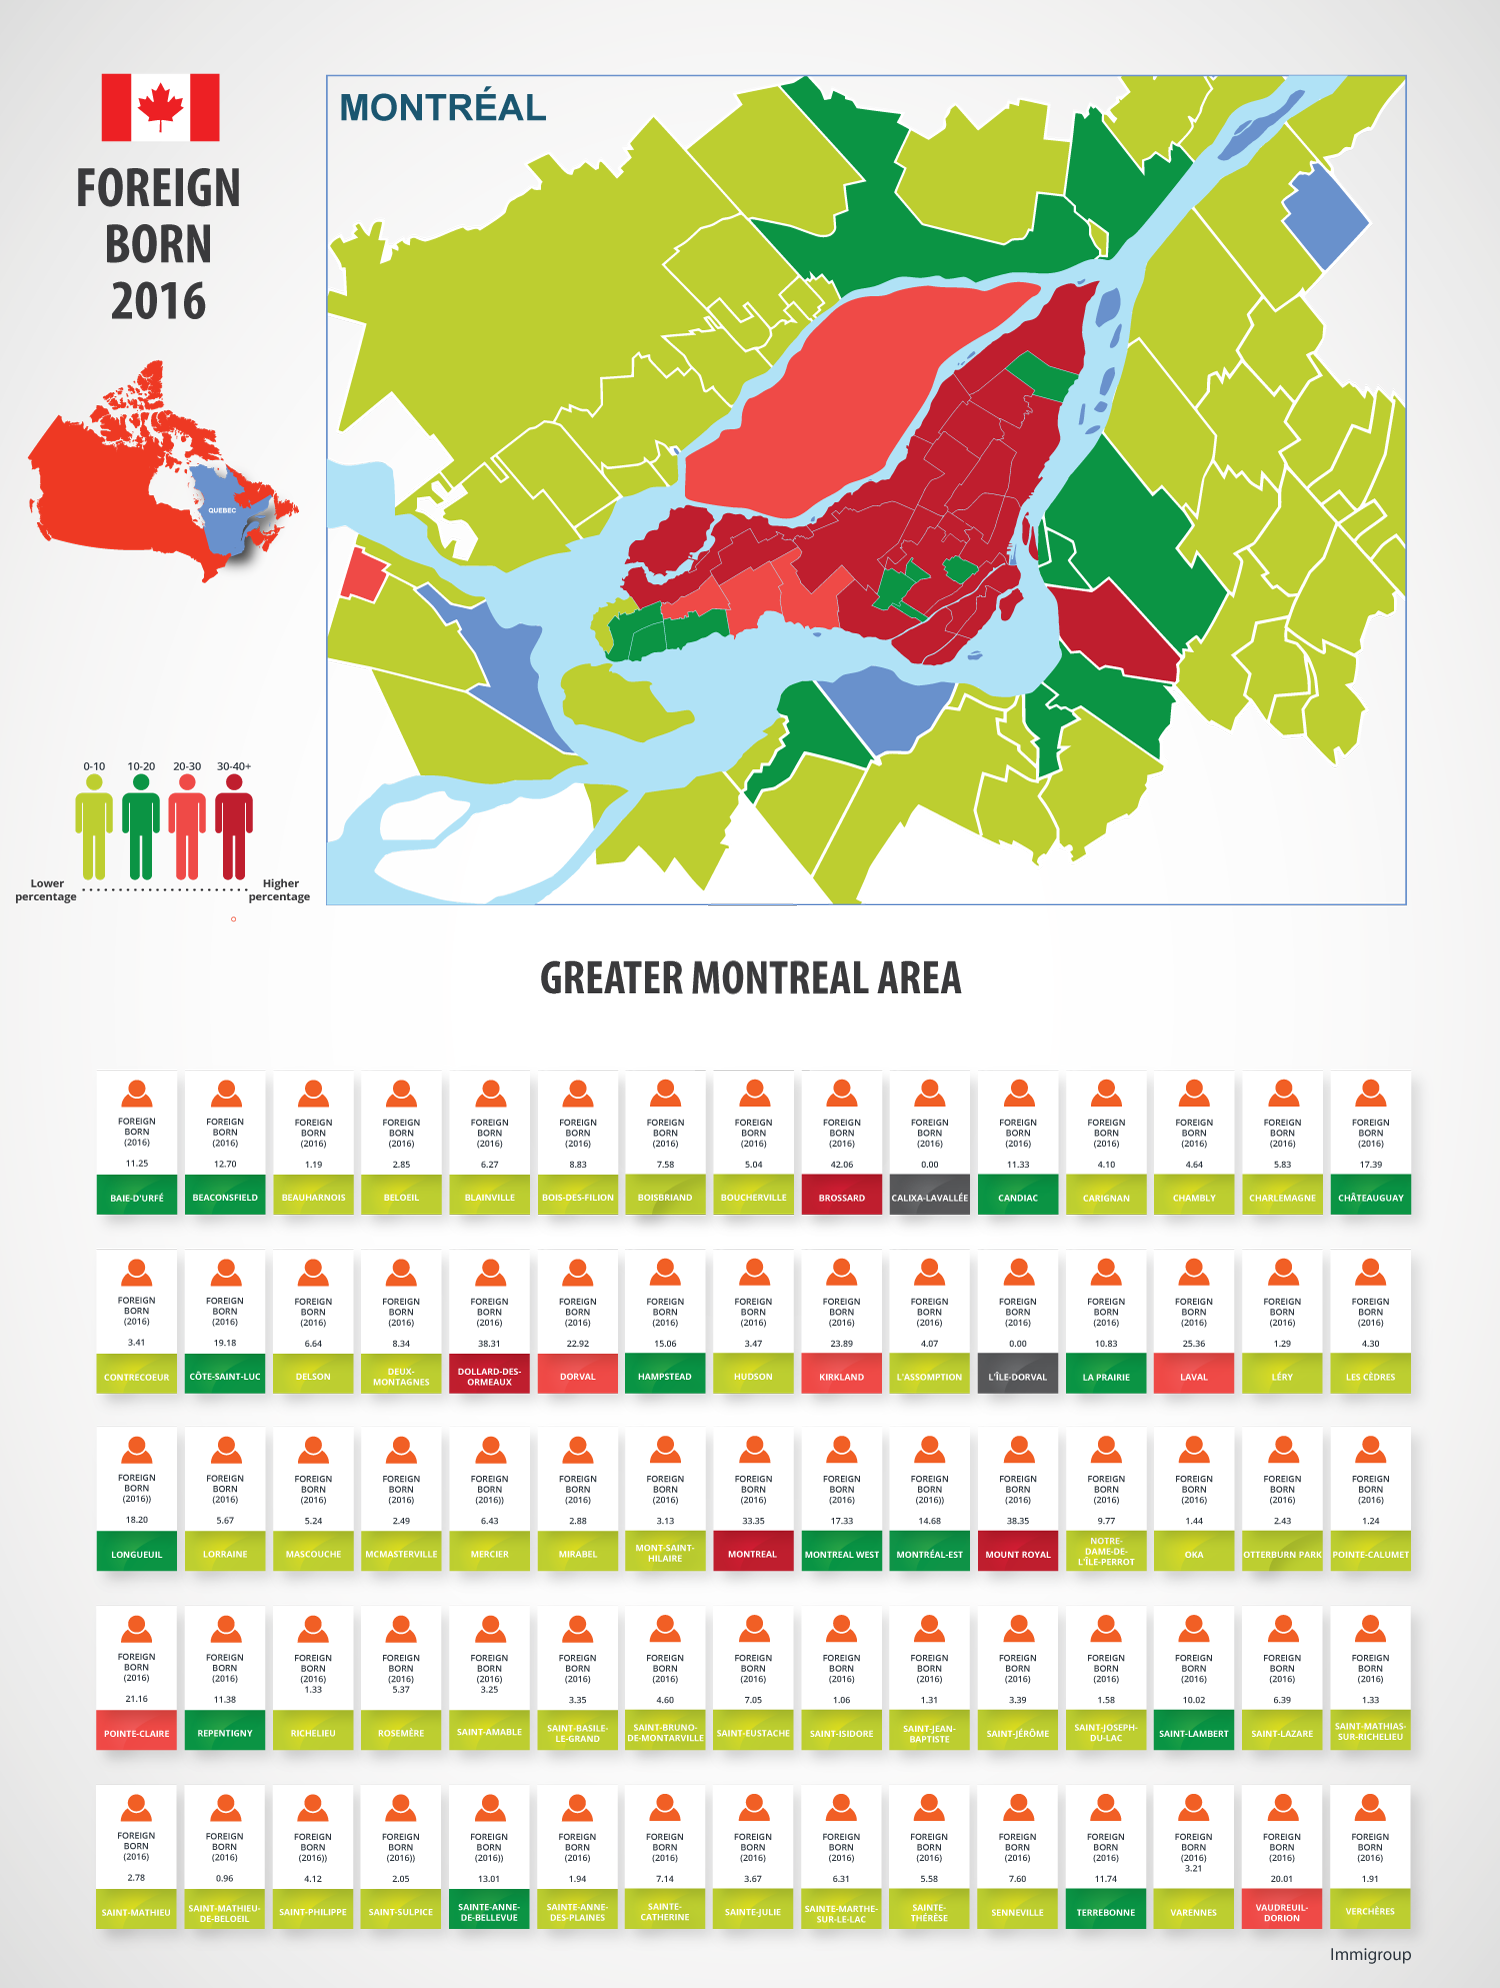
Immigrants in Montreal
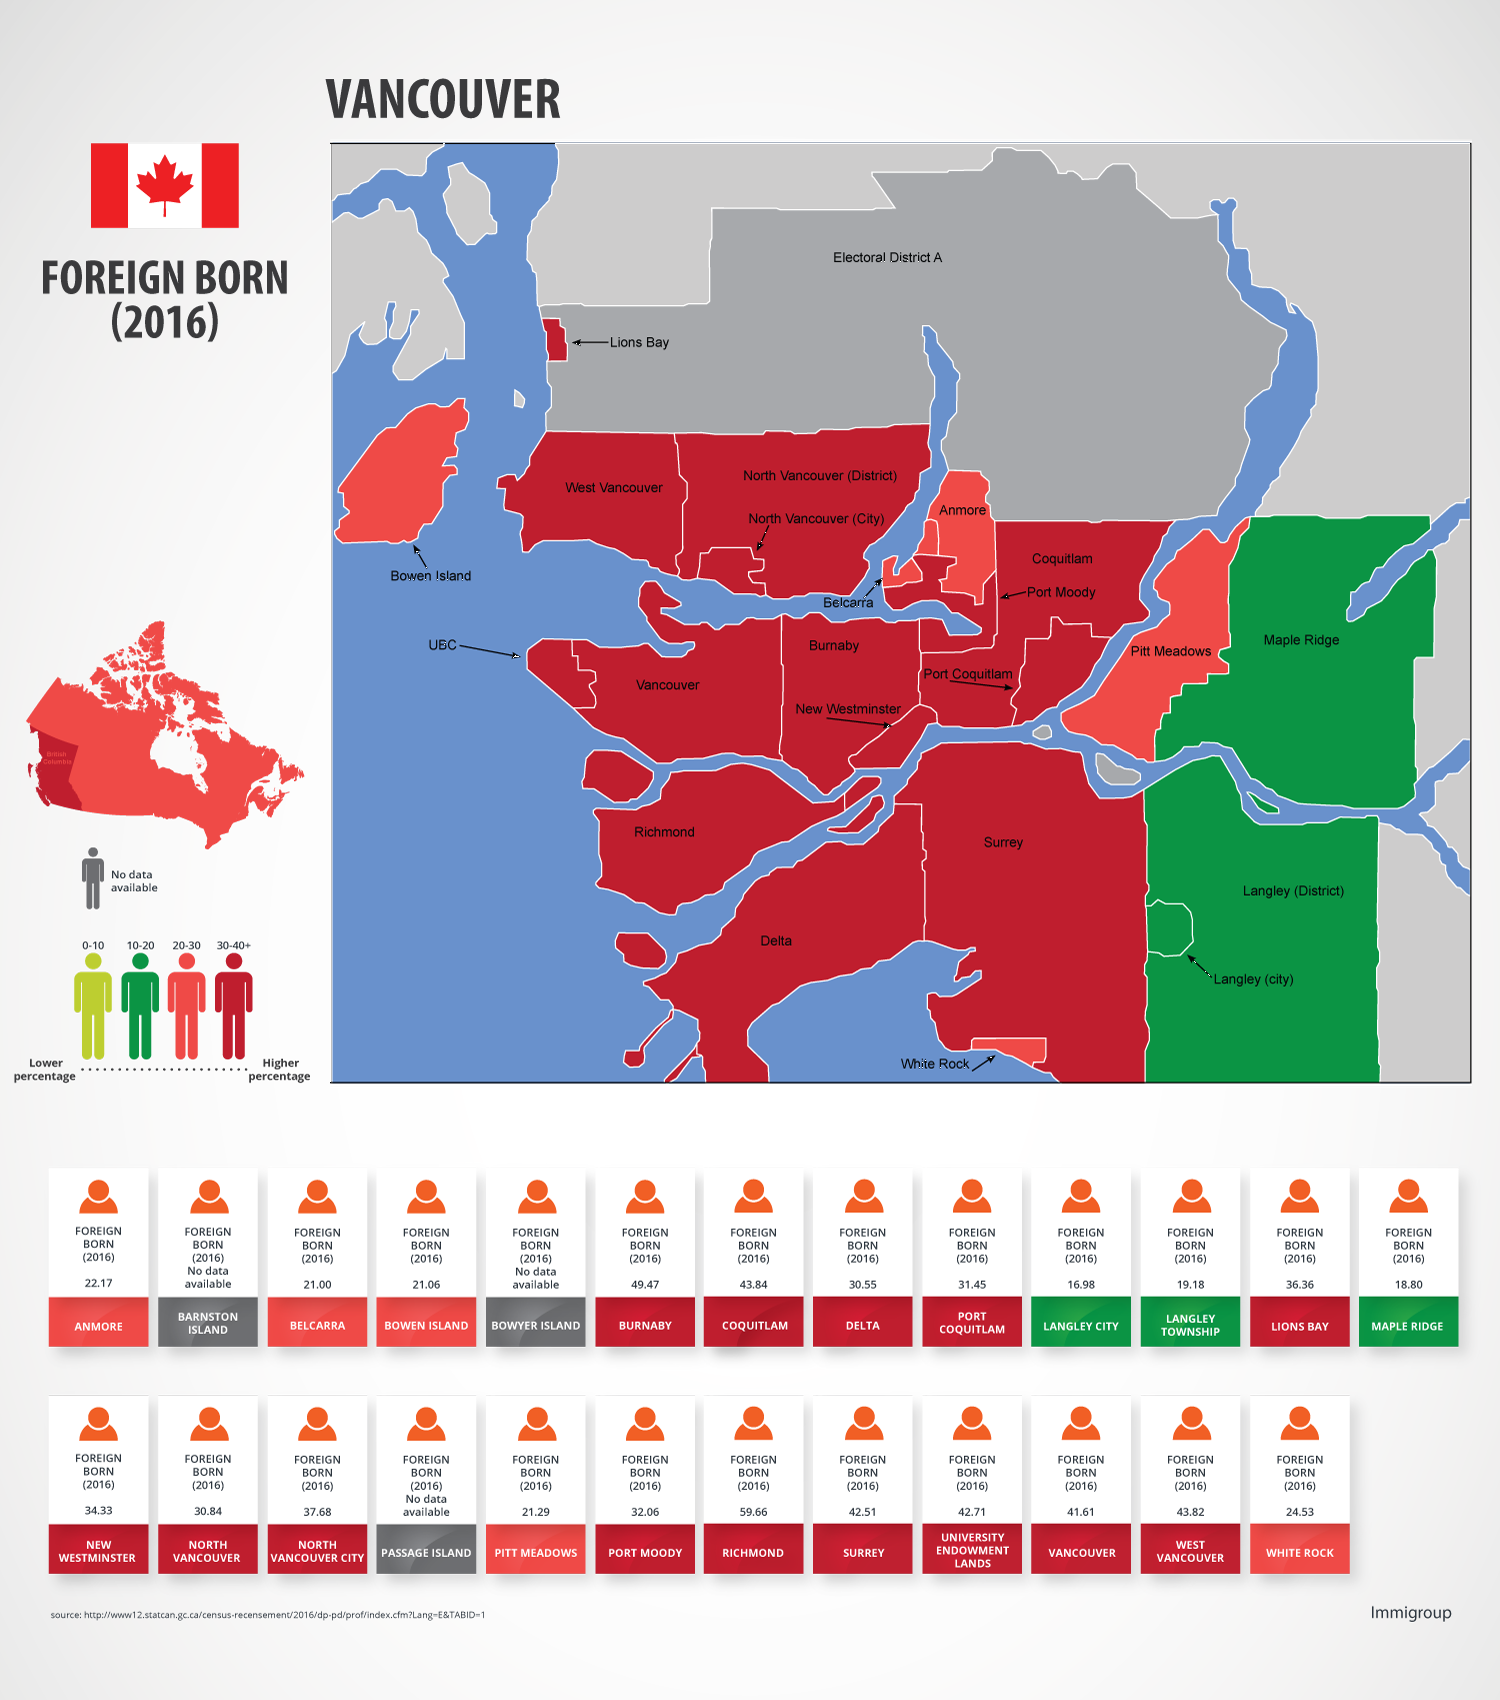
Immigrants in Vancouver
Provincial Immigration Shifts Over the Years
While between 2005 to 2014 the provinces of Ontario and Quebec proved to be the most popular provinces for settlement by new permanent residents, there were shifting trends over that span. For example, while Ontario and Quebec were the most popular settlement provinces overall; in 2005, British Columbia welcomed more immigrants than Quebec. Additionally, other less popular provinces for settlement seem to jockey for positions in terms of popularity over the years.
The following tables show the most popular states by number per year.
| Ranking | 2005 | 2006 |
|---|---|---|
| 1 | Ontario: 140,526 (54%) | Ontario: 125,891 (50%) |
| 2 | British Columbia: 44,770 (17%) | Quebec: 44,681 (18%) |
| 3 | Quebec: 43,315 (17%) | British Columbia: 42,084 (17%) |
| 4 | Alberta: 19,405 (7%) | Alberta: 20,716 (8%) |
| 5 | Manitoba: 8,096 (3%) | Manitoba: 10,048 (4%) |
| 6 | Saskatchewan: 2,119 (>1%) | Saskatchewan: 2,724 (1%) |
| 7 | Nova Scotia: 1,929 (>1%) | Nova Scotia: 2,586 (1%) |
| 8 | New Brunswick: 1,091 (>1%) | New Brunswick: 1,646 (>1%) |
| 9 | Newfoundland and Labrador: 497 (>1%) | Prince Edward Island: 565 (>1%) |
| 10 | Prince Edward Island: 330 (>1%) | Newfoundland and Labrador: 508 (>1%) |
| 11 | Northwest Territories: 84 (>1%) | Northwest Territories: 88 (>1%) |
| 12 | Yukon: 65 (>1%) | Yukon: 83 (>1%) |
| 13 | Nunavut: 12 (>1%) | Unknown: 16 (>1%) |
| 14 | Unknown: 4 (>1%) | Nunavut: 12 (>1%) |
Notably, in 2005, British Columbia ranked above Quebec and Newfoundland and Labrador was more popular than Prince Edward Island, both outliers to the trend. Additionally, in 2006, fewer permanent residents settled in Nunavut than did not have a fixed destination when they arrived in Canada.
| Ranking | 2007 | 2008 |
|---|---|---|
| 1 | Ontario: 111,316 (47%) | Ontario: 110,877 (45%) |
| 2 | Quebec: 45,200 (19%) | Quebec: 45,217 (18%) |
| 3 | British Columbia: 38,961 (16%) | British Columbia: 43,992 (18%) |
| 4 | Alberta: 20,860 (9%) | Alberta: 24,201 (10%) |
| 5 | Manitoba: 10,954 (5%) | Manitoba: 11,218 (5%) |
| 6 | Saskatchewan: 3,516 (1%) | Saskatchewan: 4,825 (2%) |
| 7 | Nova Scotia: 2,523 (1%) | Nova Scotia: 2,651 (1%) |
| 8 | New Brunswick: 1,643 (>1%) | New Brunswick: 1,856 (>1%) |
| 9 | Prince Edward Island: 992 (>1%) | Prince Edward Island: 1,443 (>1%) |
| 10 | Newfoundland and Labrador: 546 (>1%) | Newfoundland and Labrador: 616 (>1%) |
| 11 | Northwest Territories: 88 (>1%) | Northwest Territories: 127 (>1%) |
| 12 | Yukon: 83 (>1%) | Yukon: 110 (>1%) |
| 13 | Unknown: 52 (>1%) | Unknown: 52 (>1%) |
| 14 | Nunavut: 19 (>1%) | Nunavut: 50 (>1%) |
There were no notable differences in immigration patterns between 2006 and 2007 or 2008.
| Ranking | 2009 | 2010 |
|---|---|---|
| 1 | Ontario: 106,860 (42%) | Ontario: 118,110 (42%) |
| 2 | Quebec: 49,488 (20%) | Quebec: 53,983 (19%) |
| 3 | British Columbia: 41,439 (16%) | British Columbia: 44,188 (16%) |
| 4 | Alberta: 27,017 (11%) | Alberta: 32,650 (12%) |
| 5 | Manitoba: 13,521 (5%) | Manitoba: 15,807 (7%) |
| 6 | Saskatchewan: 6,890 (3%) | Saskatchewan: 7,615 (3%) |
| 7 | Nova Scotia: 2,424 (>1%) | Prince Edward Island: 2,581 (>1%) |
| 8 | New Brunswick: 1,856 (>1%) | Nova Scotia: 2,408 (>1%) |
| 9 | Prince Edward Island: 1,723 (>1%) | New Brunswick: 2,124 (>1%) |
| 10 | Newfoundland and Labrador: 606 (>1%) | Newfoundland and Labrador: 714 (>1%) |
| 11 | Yukon: 174 (>1%) | Yukon: 350 (>1%) |
| 12 | Northwest Territories: 127 (>1%) | Northwest Territories: 137 (>1%) |
| 13 | Nunavut: 10 (>1%) | Nunavut: 19 (>1%) |
| 14 | Unknown: 0 | Unknown: 2 (>1%) |
In 2009, an increasing number of immigrants settled in Yukon over the Northwestern Territories, which is likely due to Yukon’s growing economy at the time.
In 2010, Prince Edward Island overtook Nova Scotia and New Brunswick in terms of popularity, which is kind of shocking given the size of those three provinces.
| Ranking | 2011 | 2012 |
|---|---|---|
| 1 | Ontario: 99,459 (40%) | Ontario: 98,826 (38%) |
| 2 | Quebec: 51,746 (21%) | Quebec: 55,258 (21%) |
| 3 | British Columbia: 34,787 (14%) | British Columbia: 36,176 (14%) |
| 4 | Alberta: 30,961 (12%) | Alberta: 35,764 (14%) |
| 5 | Manitoba: 15,963 (6%) | Manitoba: 13,391 (5%) |
| 6 | Saskatchewan: 8,955 (4%) | Saskatchewan: 11,182 (4%) |
| 7 | Nova Scotia: 2,138 | Nova Scotia: 2,370 (>1%) |
| 8 | New Brunswick: 1,967 (>1%) | New Brunswick: 2,224 (>1%) |
| 9 | Prince Edward Island: 1,731 (>1%) | Prince Edward Island: 1,089 (>1%) |
| 10 | Newfoundland and Labrador: 682 (>1%) | Newfoundland and Labrador: 751 (>1%) |
| 11 | Yukon: 237 (>1%) | Yukon: 273 (>1%) |
| 12 | Northwest Territories: 85 (>1%) | Northwest Territories: 165 (>1%) |
| 13 | Nunavut: 24 (>1%) | Nunavut: 20 (>1%) |
| 14 | Unknown: 14 (>1%) | Unknown: 17 (>1%) |
In 2011, immigration patterns returned to those of 2009 with Nova Scotia and New Brunswick once again overtaking Prince Edward Island in terms of popularity. These immigration patterns persisted throughout 2012.
| Ranking | 2013 | 2014 |
|---|---|---|
| 1 | Ontario: 103,494 (40%) | Ontario: 95,814 (37%) |
| 2 | Quebec: 51,983 (20%) | Quebec: 50,294 (19%) |
| 3 | Alberta: 36,636 (14%) | Alberta: 42,530 (16%) |
| 4 | British Columbia: 36,210 (14%) | British Columbia: 35,170 (14%) |
| 5 | Manitoba: 13,100 (5%) | Manitoba: 16,223 (6%) |
| 6 | Saskatchewan: 10,679 (4%) | Saskatchewan: 11,823 (5%) |
| 7 | Nova Scotia: 2,529 (>1%) | New Brunswick: 2,837 (1%) |
| 8 | New Brunswick: 2,019 (>1%) | Nova Scotia: 2,670 (1%) |
| 9 | Prince Edward Island: 998 (>1%) | Prince Edward Island: 1,626 (>1%) |
| 10 | Newfoundland and Labrador: 825 (>1%) | Newfoundland and Labrador: 896 (>1%) |
| 11 | Yukon: 316 (>1%) | Yukon: 305 (>1%) |
| 12 | Northwest Territories: 150 (>1%) | Northwest Territories: 167 (>1%) |
| 13 | Nunavut: 11 (>1%) | Unknown: 26 (>1%) |
| 14 | Unknown: 3 (>1%) | Nunavut: 23 (>1%) |
In 2013, Alberta overtook British Columbia in popularity while all other immigration patterns remained as they were in 2012.
In 2014, New Brunswick and Nova Scotia once again jockeyed for position.
What Do These Numbers Mean?

When interpreting the data for immigration to Canada between 2004 and 2014, there are a few takeaways. Firstly, there are four main provinces that are always popular with new permanent residents – Ontario, Quebec, British Columbia, and Alberta. Additionally, there is a stark difference between the number of permanent residents who settle in these four most populous provinces and the number of new permanent residents who settle in the remaining provinces and territories. Over the course of a decade or so, there have always been at least twice as many new permanent residents settling in Alberta and BC than the next most popular province.