Immigration: The United States of America vs Canada
![Trump and Trudeau By Office of the President of the United States (@WhiteHouse on Twitter) [Public domain], via Wikimedia Commons](https://www.immigroup.com/wp-content/webpc-passthru.php?src=https://www.immigroup.com/wp-content/uploads/2017/04/Donald_Trump_Justin_Trudeau_2017-02-13_02.jpg&nocache=1)
Which country lets in more immigrants, the US or Canada? And where do these immigrants go?
Canada Vs. U.S. Immigration Rates
![Canada vs the US By No machine-readable author provided. Artem Karimov assumed (based on copyright claims). [Public domain], via Wikimedia Commons](https://upload.wikimedia.org/wikipedia/commons/thumb/f/fe/Canada_USA_Locator.svg/640px-Canada_USA_Locator.svg.png)
Updated with data from 2015
Immigration Patterns in Canada From 2005 to 2015
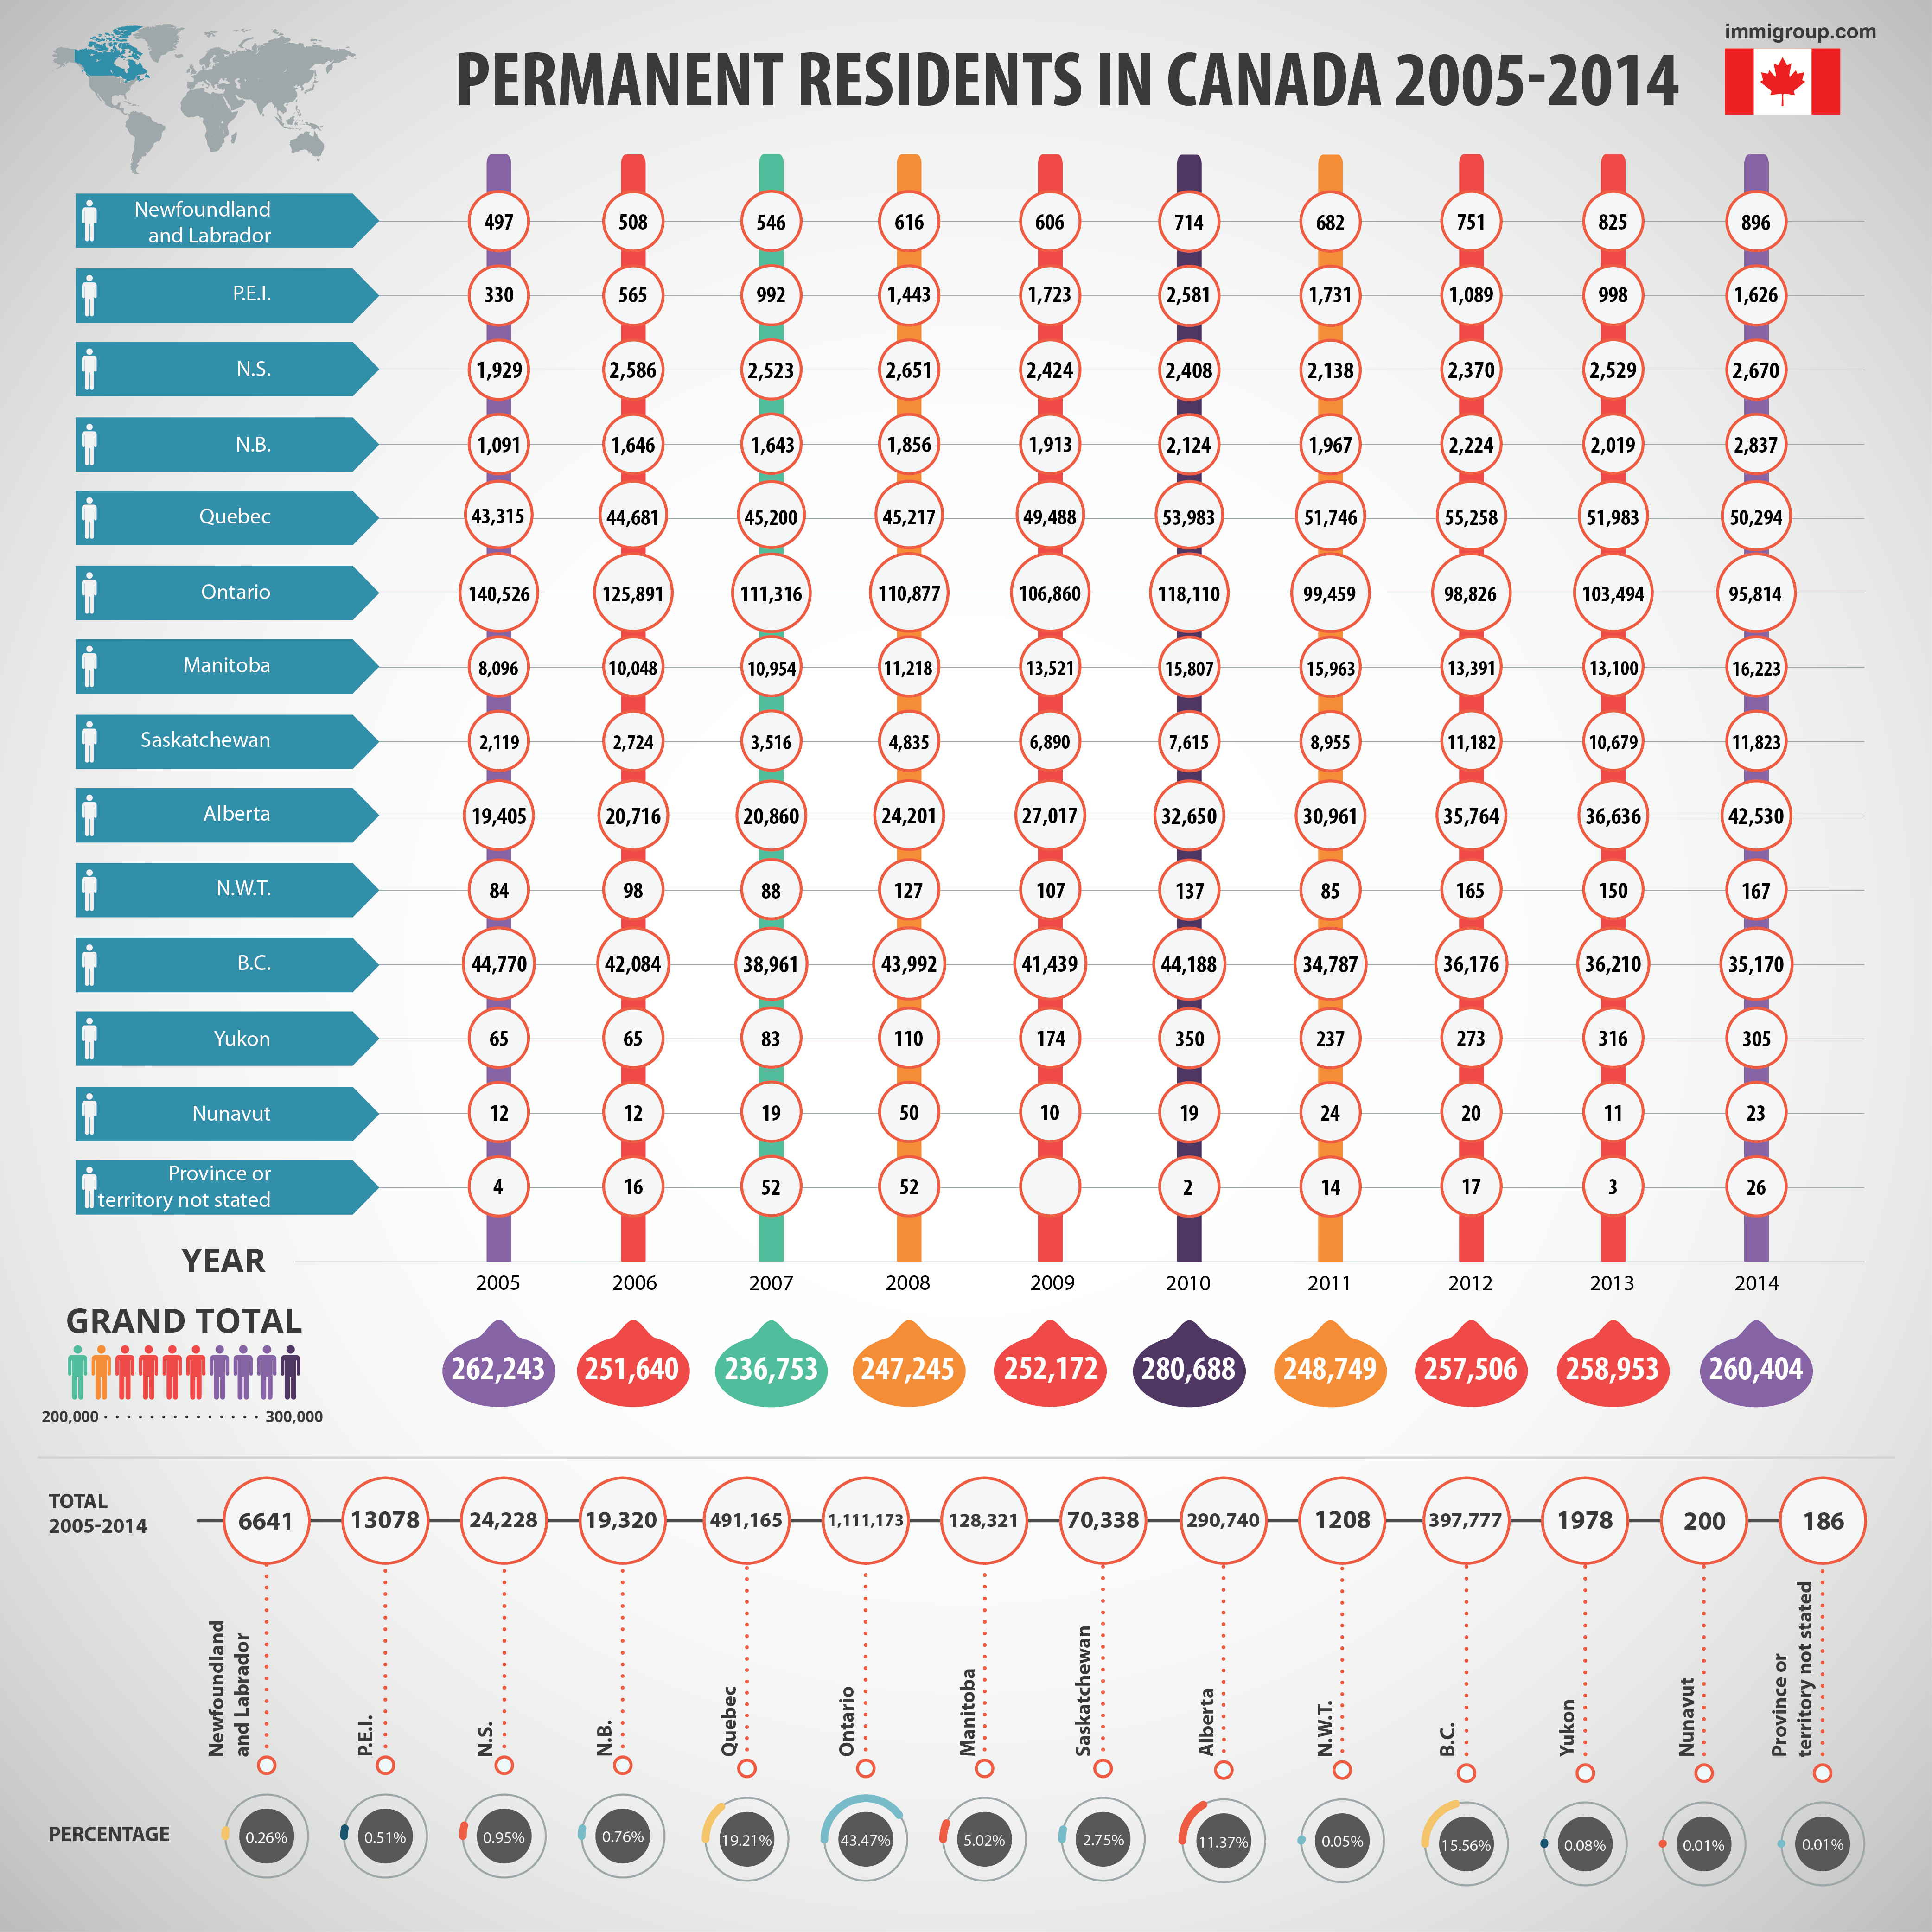
From 2005 to 2014, the immigration rate to Canada quite consistently hovered around an average of 253,000 people accepted for permanent residency in the county each year. Over this decade, 2007 showed the lowest number of new permanent residents arriving in the country with 236,753 immigrants. The highest number of immigrants during this decade arrived in 2010 when 280,688 entered the country. In 2015, Canada admitted 271,847 permanent residents, below the high of the previous decade but above the average.
Based on information provided by Statistics Canada, the increase in immigration in 2010 can be explained by a focus on processing backlogged immigration applications of previous years. Additionally, half-way through 2010, Canada increased the number of economic immigrants allowed to acquire permanent residency in the country. Finally, the 2010 Haitian earthquake led to the Canada and the provinces granting entry to many more refugees than usual. However, even the lowest year is still above the yearly immigration quota that had been set by the Canadian government.
Canada’s Immigration Patterns Highlight the Appeal of Large, Urban Areas
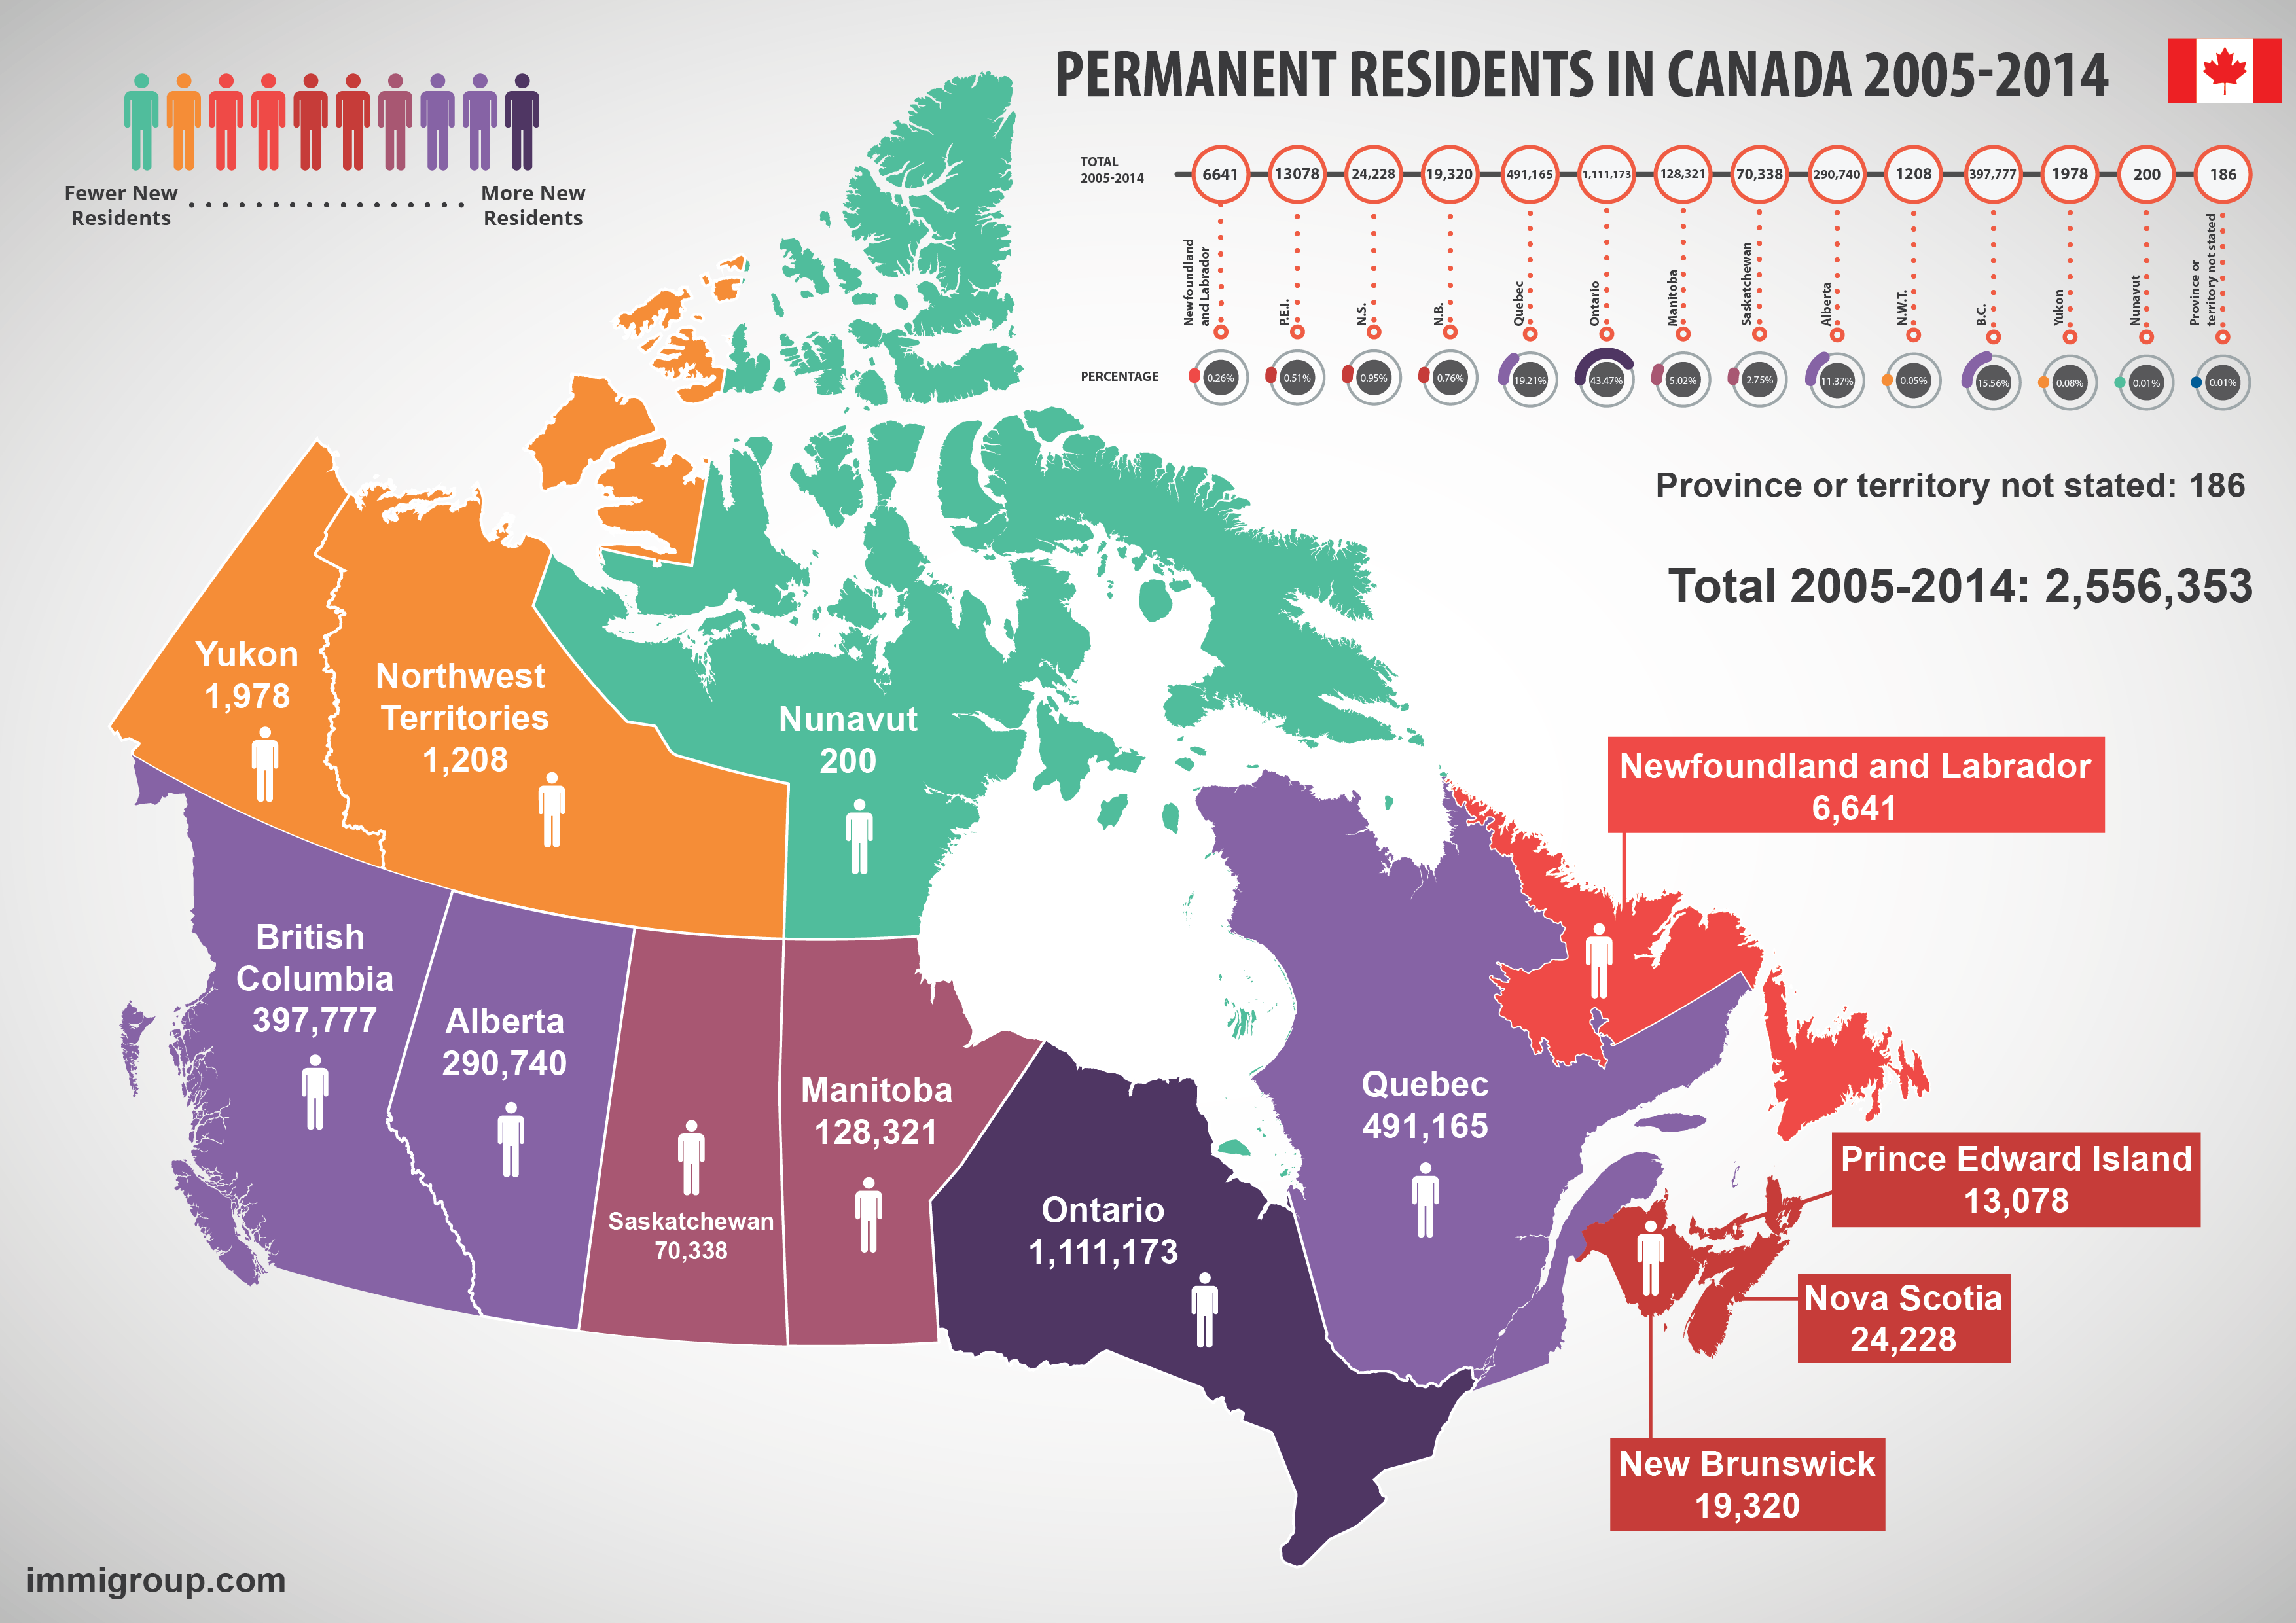
Between 2005 and 2014, the highest number of permanent residents entering the country, 43.47% or 1,111,173 people, settled in Ontario. Second to Ontario, Quebec had the next highest new immigrant population with 19.21%, or 491,165 people, settling there. Not shockingly, Nunavut saw the lowest percentage of new immigrants settling with just 0.01%, or 200 people coming to the territory. This pattern did not change much in 2015 but more recent data suggests it has changed a little between 2014 and the present day. When we have the data we will update this article.
Over the decade, shifts among popular provinces for immigrant settlement took place, though the draw of larger urban areas continued. Ontario, Quebec, British Columbia, Alberta, and Manitoba remained the five most popular provinces throughout this time period.
Immigration Patterns in the U.S. From 2005 to 2015
| Year | Total Number oF New Immigrants |
|---|---|
| 2005 | 1,122,257 |
| 2006 | 1,266,129 |
| 2007 | 1,052,415 |
| 2008 | 1,107,126 |
| 2009 | 1,130,818 |
| 2010 | 1,042,625 |
| 2011 | 1,062,040 |
| 2012 | 1,031,631 |
| 2013 | 990,553 |
| 2014 | 1,016,518 |
| 2015 | 1,051,031 |
From 2005 to 2015, the United States saw an average of 1,079,377 immigrants becoming permanent per year. Over this period, 2006 saw the highest number of new permanent residents with 1,266,129 immigrants. The lowest number of immigrants entered the country in 2013 when 990,553 immigrants were granted permanent residents in the United States.
Based on information provided by MigrationPolicy.org, the increase in new immigrants in 2006 can be explained in part by the House of Representatives passing the Republican-sponsored Border Protection, Antiterrorism, and Illegal Immigration Control Act in late 2005. This pending “tightening the belt” on immigration to the United States, led to an influx of immigrants hoping to gain residency prior to the stricter immigration regulations.
The lowest rate of immigration seen in 2013 can be explained according to Pew Research Data, by a record number of deportations by the Obama administration: some 438,421 unauthorized immigrants were deported from the country in 2013. This crackdown on deporting unauthorized immigrants impacted the U.S. economy was accompanied by increased border security and closer monitoring of working immigrant populations.
The United States Immigration Patterns Highlight the Appeal of Large, Urban Areas
| Year | Top 5 States for Total Permanent Residents in the United States | |
|---|---|---|
| 2005 | Unavailable at this time | |
| 2006 | California | 3,430,000 |
| New York | 1,490,000 | |
| Texas | 1,160,000 | |
| Florida | 1,040,000 | |
| New Jersey | 570,000 | |
| 2007 | California | 3,540,000 |
| New York | 1,560,000 | |
| Texas | 1,240,000 | |
| Florida | 1,140,000 | |
| New Jersey | 590,000 | |
| 2008 | California | 3,440,000 |
| New York | 1,530,000 | |
| Texas | 1,250,000 | |
| Florida | 1,170,000 | |
| New Jersey | 580,000 | |
| 2009 | California | 3,310,000 |
| New York | 1,530,000 | |
| Texas | 1,220,000 | |
| Florida | 1,180,000 | |
| New Jersey | 560,000 | |
| 2010 | California | 3,330,000 |
| New York | 1,560,000 | |
| Texas | 1,240,000 | |
| Florida | 1,210,000 | |
| New Jersey | 570,000 | |
| 2011 | California | 3,380,000 |
| New York | 1,620,000 | |
| Texas | 1,280,000 | |
| Florida | 1,270,000 | |
| New Jersey | 600,000 | |
| 2012 | California | 3,400,000 |
| New York | 1,660,000 | |
| Texas | 1,310,000 | |
| Florida | 1,290,000 | |
| New Jersey | 610,000 | |
| 2013 | California | 3,310,000 |
| New York | 1,650,000 | |
| Texas | 1,320,000 | |
| Florida | 1,260,000 | |
| New Jersey | 600,000 | |
Between 2006 and 2013, new immigrants flocked to the same five states in mass numbers. These five states rank identically in popularity from year to year with California remaining the top state for new immigrants. All five of these popular states for legal permanent resident populations are populous, urban states with large economic centres. The draw of these states is likely the availability of opportunities for work, their proximity to ports of entry, and preexisting immigrant communities in many cities. You can see how this has trend has continued below:
| Year | State | New Permanent Residents |
|---|---|---|
| 2013 | California | 191,806 |
| New York | 133,601 | |
| Florida | 102,939 | |
| Texas | 92,674 | |
| New Jersey | 53,082 | |
| 2014 | California | 198,379 |
| New York | 141,406 | |
| Florida | 109,310 | |
| Texas | 95,295 | |
| New Jersey | 51,609 | |
| 2013 | California | 209,568 |
| New York | 130,010 | |
| Florida | 118,873 | |
| Texas | 99,727 | |
| New Jersey | 51,609 |
How Does Immigration to Canada Compare to Immigration in the U.S. From 2005 to 2015?
When comparing immigrating populations in the U.S. and Canada, it is important to note, first, that the number of immigrants seeking residency in the United States is significantly higher than those seeking residency in Canada. For example, the highest incoming immigrant population for Canada was 280,688 in 2010. In comparison, the highest incoming immigrant population for the United States was 1,266,129 in 2006! Even on a “slow year” for immigration, we can see the vast immigration gap between the U.S. and Canada. Between 2005 and 2015, the lowest number of immigrants granted residency in Canada was 236,753 in 2007. Compare that to the lowest number of new immigrants in the U.S. – 990,553 in 2013, and you still have more than four times the immigrants granted entry to the United States!
But what about patterns of settlement in the U.S. and Canada by legal permanent residents? A pattern of immigration to metropolitan areas is clearly noticeable. Whether immigrating to Canada or the U.S., permanent residents are making homes in populous locations that offer increased economic opportunity.
Something else worth noting is that in the United States, there is a noticeable flock of immigrants to locations in close proximity to immigration ports of entry. It could simply be a coincidence that these economically and culturally rich areas in the U.S. also happen to be close to immigration entry points but in Canada there is a similar pattern, if we look close enough. Immigrants to the US settle near the Mexican border, the Caribbean or New York City. In Canada, they settle near the major airports in major cities.
So, What Do These Figures Mean?
The United States welcomes more new immigrants per year than Canada does, but the US also has 10 times more people than Canada does. As a proportion of population, Canada brings in more immigrants than the United States. For example, in 2014:
| new Immigrants in 2014 | Total | Percentage of 2014 Population | New Immigrants in 2015 | Percentage of 2015 Population |
|---|---|---|---|---|
| canada | 260,404 | 0.73% | 271,847 | 0.76% |
| United States of America | 1,016,518 | 0.32% | 1,051,031 | 0.33% |
So, whereas the raw numbers make it look like the United Sattes welcomes way more immigrants per year, Canada welcomes far, far more immigrants per year as a proportion of the population of the country.
Which country has the more appropriate policy is another story.