Canada in 20 Years

Statistics Canada recently released a projection of the Canadian population as far ahead as 2036. Using a variety of statistical analysis, the study focused on immigration, ethnocultural diversity, and language. So, just what did the study project the Canadian population to look like over the next twenty years?
What Canada Will Look Like in 2036: Canadian Immigration, Diversity, and Language From 2011-2036

Statistics Canada recently released a projection of the Canadian population as far ahead as 2036. Using a variety of statistical analysis, the study focused on immigration, ethnocultural diversity, and language. So, just what did the study project the Canadian population to look like over the next twenty years?
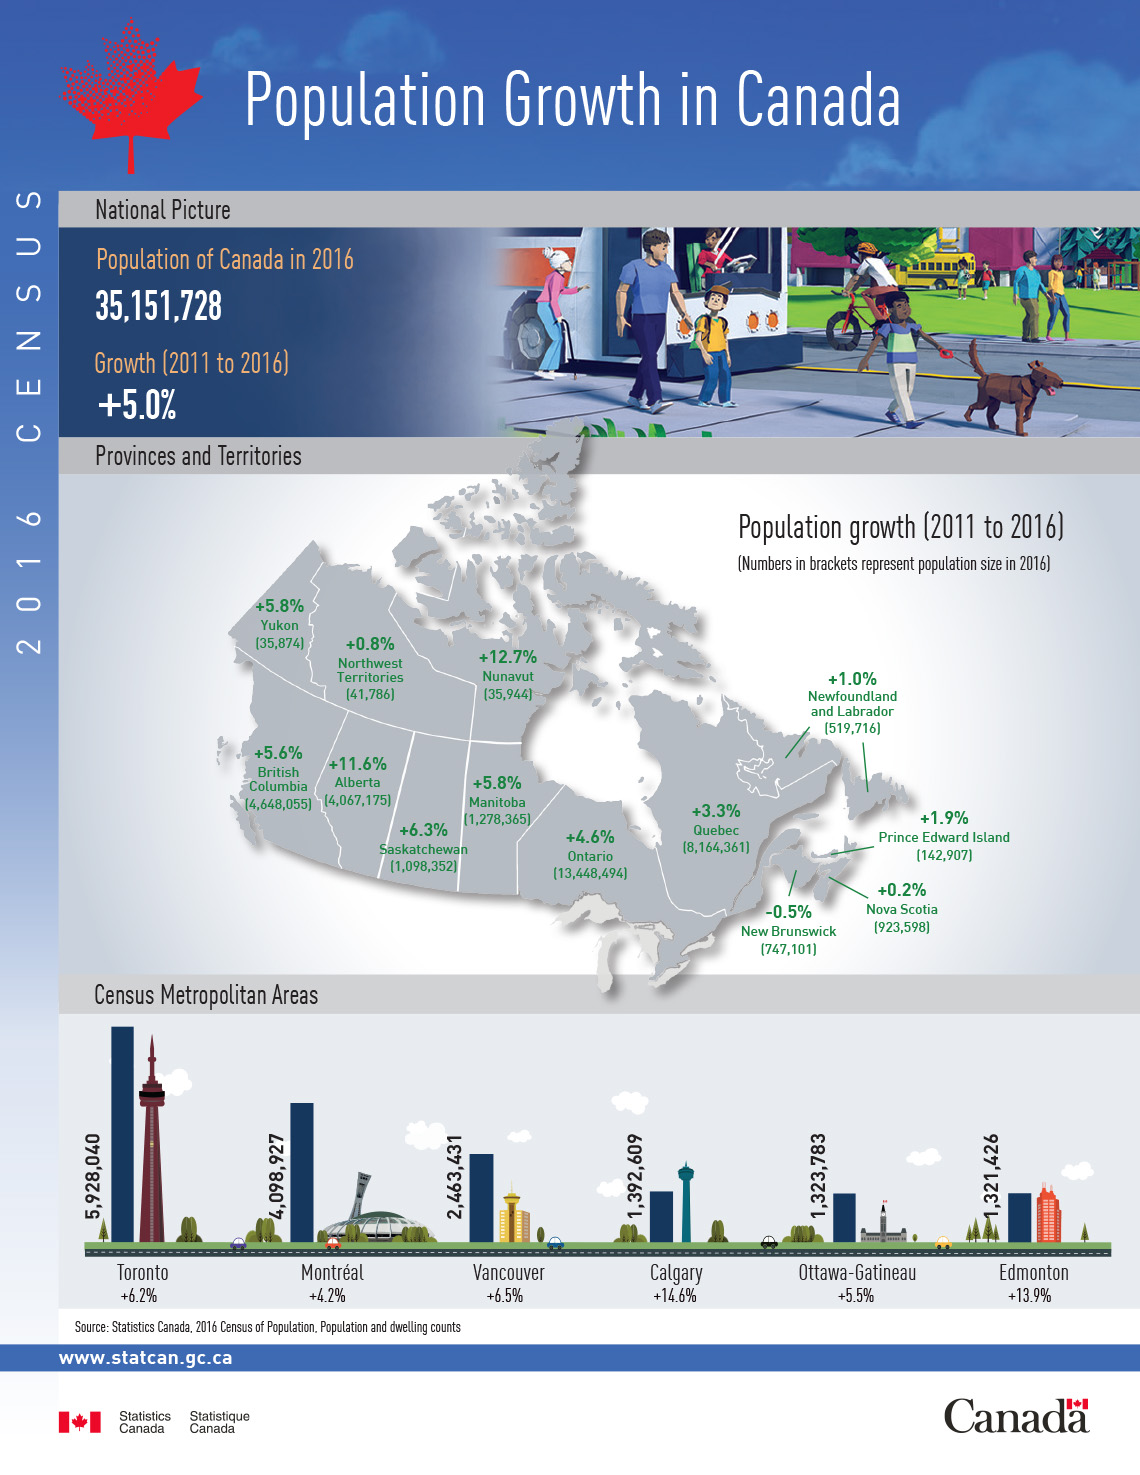
Canada’s Population Growth since 1850
Immigration
30.0% of Canada’s Population Will Be Immigrants

In 1867, the first census conducted on the 3.7 million people living in Canada found that 16.1% of those people were born outside of the country. So, how does this compare to the Canada of today and the Canada of the future? As of 2011, 20.7% of the Canadian population were immigrants and 17.5% of the population had one parent who was an immigrant. Using recent methodological developments, Statistics Canada projects that by 2036, between 24.5% and 30% of the Canadian population will be immigrants. Additionally, 19.7% of the population will have at least one parent who was born outside of the country.
How does this translate to the Canadian population as a whole? As of 2011, 38.2% of the Canadian population were either first or second generation immigrants. By 2036, it is projected that between 44.2% and 49.7% of the population will be first or second generation immigrants. That means that by 2036 almost one of every two Canadian residents will be a first or second generation immigrant.
| Immigrants in Canada | 2011 | 2036 | % Change |
|---|---|---|---|
| First Generation ImmigraNts | 20.7% | Between 24.5% and 30% | Between +3.8% and +9.3% |
| Second Generation Immigration | 17.5% | 19.7% | +2.2% |
| Total (first and second generation) | 38.2% | Between 44.2% and 49.7% | Between +6% and +11.5% |
The Concentration of Canada’s Immigrant Population Will Remain in Metropolitan Areas
While Canada’s first generation immigrant population is projected to grow as much as 9.3% over the next twenty years, the concentration of immigrant populations is not expected to change.
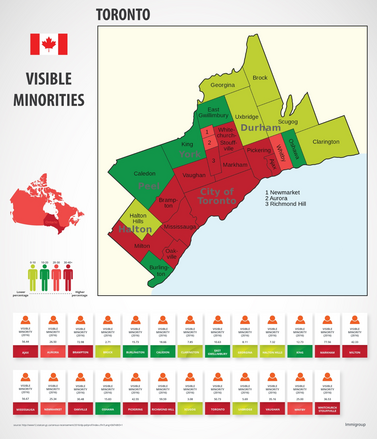
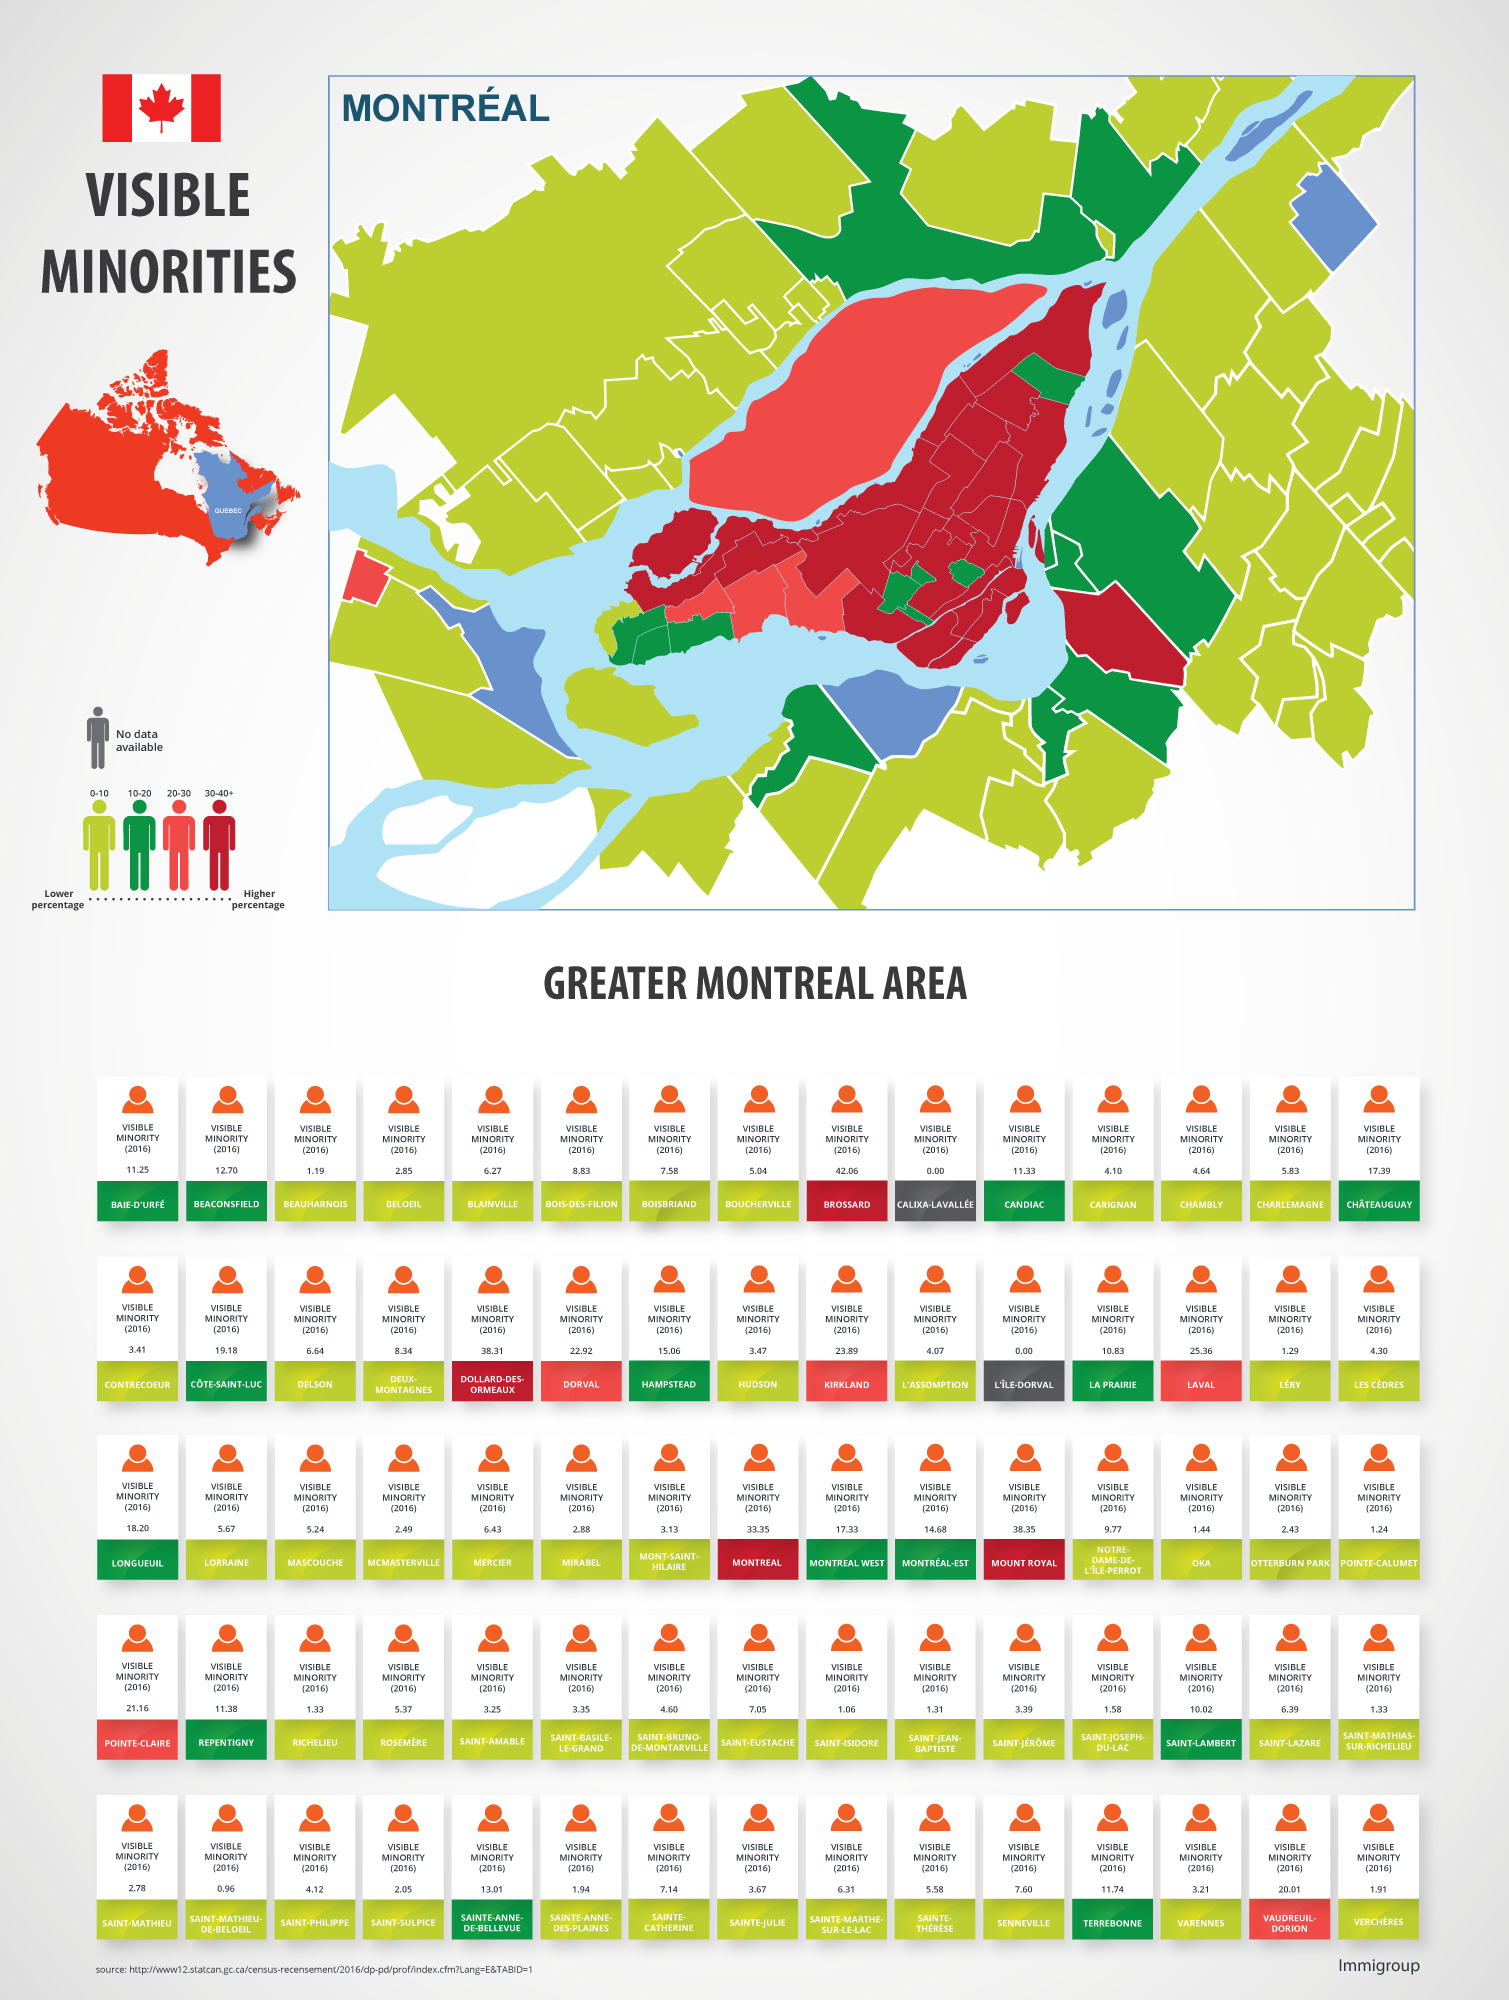
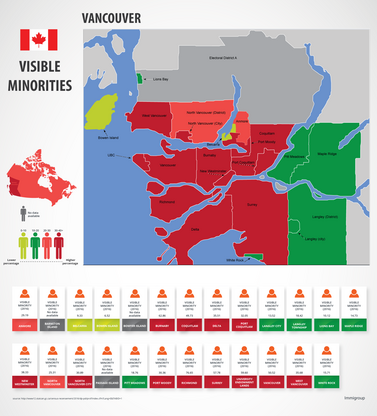
In 2011, census data showed that a little more than 90% of Canada’s immigrant population was centered in the biggest metropolitan areas, namely Toronto, Montreal, and Vancouver. By 2036, this concentration is expected to be relatively similar with between 33.6 and 39.1% of immigrants living in Toronto, 13.9 to 14.6% of immigrants living in Montreal, and 12.4% to 13.1% of immigrants living in Vancouver.
When considering both first and second generation immigrants, StatsCan projected that by 2036 around three of every four individuals in Toronto and Vancouver will be immigrants or born to an immigrant parent. Approximately 77% to 81.4% of Toronto’s population will be first or second generation immigrants and 69.4% to 74% of Vancouver’s population will be first or second immigrants.
| 2036 | First Generation immigrants | First and Second Generation Immigrants |
|---|---|---|
| Toronto | Between 46% and 52.8% | Between 77% and 81.4% |
| Vancouver | Between 42.1% and 48.5% | Between 69.4% and 74% |
Ethnocultural Diversity
“Visible” Minority Groups Will Comprise More Than 1/3 of the Working-Age Population
As immigrant populations change over the next twenty years, it is not unreasonable to expect that the ethnic diversity of Canada will change as a result. Statistics Canada projects that the two ethnic groups most impacted by this change will be those of European descent and those of Asian descent.
In 2011, approximately 44.8% of Canada’s immigrant population were Asian-born. By 2036, however, this percentage is expected to increase to between 55.7% and 57.9%. On the other hand, in 2011, 31.6% of the immigrant population in Canada were European-born. By 2036 this percentage is expected to decrease to between 15.4% and 17.8%.
What impact will this have on the working-age population? By 2036, of those aged 15 to 64 years old, between 34.7% and 39.9% will belong to a “visible” minority group. This is an increase from 19.6% in 2011. The most highly represented group in the workforce will not change, however, and will remain with those of South Asian origin.
| Origin | Immigrant Population in 2011 | Immigrant Population in 2036 | % Change |
|---|---|---|---|
| Asian Origin | 44.8% | Between 55.7% and 57.9% | +10.9% to +13.1% |
| European Origin | 31.6% | Between 15.4% and 17.8% | -13.8% to -16.2% |
The Population of Those with Non-Christian Religious Beliefs Will Double
As the nationality of Canada’s immigrant groups is projected to shift over the next twenty years, so too is the representation of different faith groups. What kind of a shift can be expected? In 2011, 9% of Canada’s population identified with a non-Christian faith. By 2036, this number is expected to increase to between 13% and 16% of the population. In particular, projections see between 5.6% and 7.2% of the Canadian population identifying as Muslim, between 2.5% and 2.9% identifying as Hindi, and between 2.3% and 2.7% identifying as Sikh.
In addition to this growth within non-Christian faith-based populations, the population of those who are unaffiliated with any faith-based group is also expected to increase. Projections see between 28.2% and 34.6% of the Canadian population having no religious affiliation by 2036.
Language

The English and French-Mother-Tongue Population Will Decline
The influx of diversity that is expected to continue over the next twenty years is also expected to impact the language demographics of Canada. In 2011, around 58.7% of the Canadian population spoke English as their mother-tongue. By 2036, this number is expected to decline to between 52% to 56%. Likewise, the population of individuals for whom French is their mother-tongue is expected to decrease from 21.3% in 2011 to between 17% to 18% in 2036.
What type of impact will this decline in English and French mother-tongue speakers have on the overall population in Canada? English will remain most prevalent mother-tongue of Canadian residents, and despite the decline, the French mother-tongue population would still far outweigh any other native tongue.
As prevalent as the French-speaking population will be in 2036, though, the decline in population is going to be particularly noticeable in areas like Quebec. In 2011, 79% of Quebec residents spoke French as their mother tongue; however, by 2036, this percentage is expected to decline to between 69% and 72%.
| Mother Tongue | 2011 | 2036 | % Change |
|---|---|---|---|
| English | 58.7% | Between 52% to 56% | -2.7% to -6.7% |
| French | 21.3% | Between 17% to 18% | -3.3% to -4.3% |
English and French will Remain Most Prevalent
Declines in English and French-mother-tongue populations in mind, the majority of the Canadian population will continue to speak either French of English in their homes. Projections see between 82% and 85% of the Canadian population speaking either French or English in their private homes by 2036. Additionally, some 78% of the total population will speak English as their first official language spoken, an increase from 75.4% in 2011. Conversely, the percentage of the population for whom French is their first official spoken language will decrease from 23% in 2011 to 21% in 2036.
What does Statistics Canada say about the bilingual population in Canada? Projections see an increase in the prevalence of bilingualism among Canadians from 17.5% in 2011 to 18.5% in 2036. The greatest increase in this percentage will be seen in the Quebec French-mother-tongue population which will grow from 39% in 2011 to 49% in 2036.
What Does It Mean?
So what do these projections mean for Canada? By 2036, Canada expects to see an increase in both first and second-generation immigrants. These increases will be particularly noticeable in metropolitan areas like Toronto and Vancouver. Additionally, by 2036, a larger portion of the working-age population will belong to a “visible” minority group. Of these groups, the South Asian population will be most highly represented. 2036 will also see an increase in diversity among faith-based groups. Lastly, while English and French mother-tongue populations will decline, they will remain the prevalent languages of Canada.
In short, while the diversity of Canada’s population will increase, the number of speakers of both official languages are expected to remain the same over the next twenty years.
by Minister of Industry / StatsCan / Statistics Canada Open License Agreement